


Whether you’re a fervent football fan or an ardent adherent to America’s favorite past-time, every fan loves it when their team gets to play with the home-field advantage.
After all, with the fans and the stadium grounds on their side, there’s no reason they should lose, right?
If you’re feeling a tad superstitious, you might feel that no matter how well your team plays at home, they tend to lose more than they win.
If anything, you might feel that your favorite team owns a rather unlucky stadium.
Alternatively, you might see your team as having the luckiest stadium in the world, especially if they win the vast majority of their home games!
Either way, it’s hard to deny luck’s role in all sports!
So, with that in mind, and this year’s “Big Game” being held in the neutral Caeser’s Superdome, we wanted to find out more about which US and Canadian stadiums were considered the luckiest in North America.
Take a look below to see if your team’s home made the top spot!
The luckiest stadiums in the US and Canada
We have Roger’s Place, Starting with the luckiest stadiums in the US and Canada.
Home to Canada’s Edmonton Oilers of NHL fame, the team boasts an impressive win rate of 68% at home, with 89% of saves being made and around 16.46 blocks per game, giving it a total luck score of 80.64 out of 100.
Next, following closely behind, we have another Canadian contender – the similarly named Roger’s Arena.
With a luck score of 78.55, the Vancouver Canucks, another NHL team, enjoy an average home win percentage of 66%, blocking 14.44 shots per game and saving 88% of pucks flying their way.
For our third luckiest North American stadium, we have the Dignity Health Sports Park.
The home of the MLS team Los Angeles Galaxy, LAG has an average home win record of 80.95%, a clean sheet rating of 24%, and a general home advantage score of 13%, for a total luck score of 77.28.
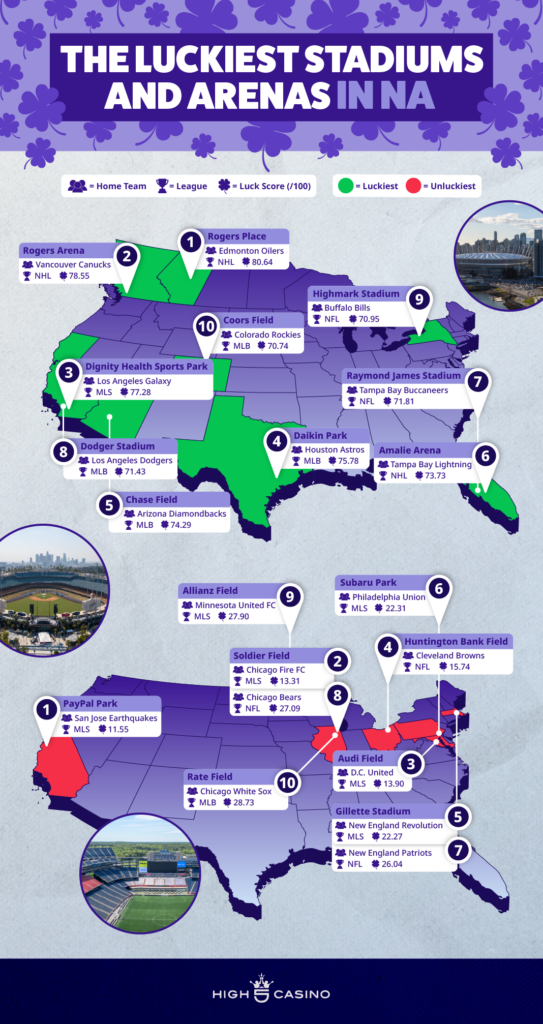
The unluckiest stadiums in North America
As for the unluckiest stadiums in the US and Canada, MLS seems intent on claiming all three bottom three spots.
First and foremost, we have PayPal Park, which is home to the San Jose Earthquakes.
With a home win percentage of just 24% and a clean sheet of just 6%, the Earthquakes get a luck score of just 11.55 out of 100!
And the news doesn’t get much better for Soldier Field and Chicago Fire FC, who only have a win rate at home of 29.41%, though they do have double the clean sheet record at 12%.
However, with an abysmal home advantage of 0%, Soldier Field has a middling luck score of only 13.31.
Lastly, we have Audi Field, home to D.C. United. With a luck score of only 13.90, Audi Field shares the same home wins percentage and clean sheet record as PayPal Park (24% and 6%) and actually has a negative home advantage of 1%!
However, due to a few other smaller factors we considered (such as goals scored), Audi Stadium just saves itself from the bottom two spots.
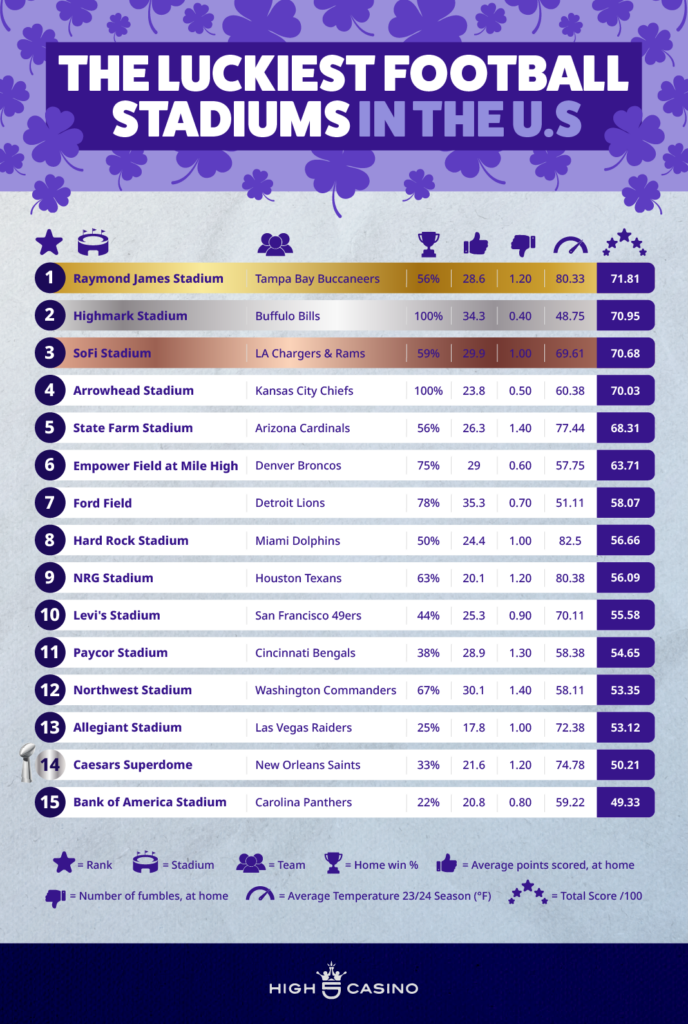
The luckiest NFL stadiums
With our top and bottom overall stadiums covered, let’s look at a breakdown of the top stadiums for each major league, starting with the NHL!
First up, with a luck score of 71.81 out of 100, we have Raymond James Stadium.
The Tampa Bay Buccaneers’ home field might only have an average home win percentage of 56%.
Still, they more than make up for this with high average play temperatures of 80.33 °F (making for better play conditions) and a fumble rate of only 1.2 per home game, putting them in the perfect position to win if the conditions are right.
Following on from the Raymond James Stadium, in second place, we have the Highmark Stadium – home to the Buffalo Bills and their impressive home win rate of 100% and a luck score of 70.95!
Indeed, with a win rate like that, you’d think the Bills would come first, but with much lower temperatures of 48.75 °F, the Raymond James Stadium just pips them to the post.
Next, we headed to SoFi Stadium, which houses the Los Angeles Chargers and Rams, and scored 70.68 for luck.
Again, this stadium’s win rate is actually higher than Raymond Park’s at 59%. However, much like the Bills, lower temperatures and worse-than-average weather conditions keep the SoFi stadium lower on our list.
Finally, in fourth and fifth place, we have the Arrowhead Stadium and State Farm Stadium, with luck scores of 70.03 and 68.31, respectively.
Here, the Kansas City Chiefs and Arizona Cardinals enjoy high win rates, but lower points scored per game overall (23.8 and 26.3), preventing their stadiums from shifting that much higher in the luck category.
The luckiest MBL stadiums
Switching over to Major League Baseball, our luckiest stadium in this league is Daikin Park.
The Houston Astros’ field of choice, Daikin Park, enjoys a solid luck score of 75.78.
The Astros enjoy an average home win rate of 54%, 35 comeback wins, and an average of 0.7 fielding errors by opponents per game!
Then, in the second, we arrive at Chase Field and the Arizona Diamondbacks. Just behind Daikin Park with a luck score of 74.29, the Diamondbacks actually enjoy a higher win rate than the Astros at 67%, though their lower level of opponent errors (0.58) and an average of 3.03 walks per game means they don’t quite land in first.
Moving to third, we see Dodger Stadium. Home to the Los Angeles Dodgers and a luck score of 71.43, the Dodgers enjoy an average win rate of 54% (only 0.10% lower than the Astros), while also enjoying 45 comeback wins.
But once again, a lower rate of opponent errors (0.49) keeps Dodger Stadium slightly lower in the rankings.
Last but not least, Coors Field and Target Field take the fourth and fifth spots, with luck scores of 70.74 and 66.66, respectively.
Once again, opponents’ fielding errors keep the Coors and Target Fields down in the luck rankings (0.61 and 0.54, respectively), but fans visiting this stadium can rest easy in the knowledge that their team’s home is one of the luckiest in the MLB.
The luckiest MLS stadiums
Moving onto the MLS, we can keep things short and concise, seeing as the Dignity Health Sports Park and Los Angeles Galaxy placed top of our list for luck.
Boasting a score of 77.28 and a home win percentage of 81%, fans of LA Galaxy are definitely home to one of the luckiest stadiums in the US.
But what about our second-placed MLS stadium? Well, for that, we turn to the BMO Stadium. The home of Los Angeles FC, BMO has a luck score of 69.62, thanks to their average win percentage of 65%.
Los Angeles FC also enjoys a 40% clean sheer rating and a 17% home-field advantage, which puts it only slightly below the LA Galaxy.
Finally, to round out the MLS, we have Chase Stadium. Inter Miami FC’s favored playing ground earned a luck score of 65.79, thanks to Miami FC’s 63% win rate and 21% clean sheet rating, both of which contributed greatly to its third-place spot!
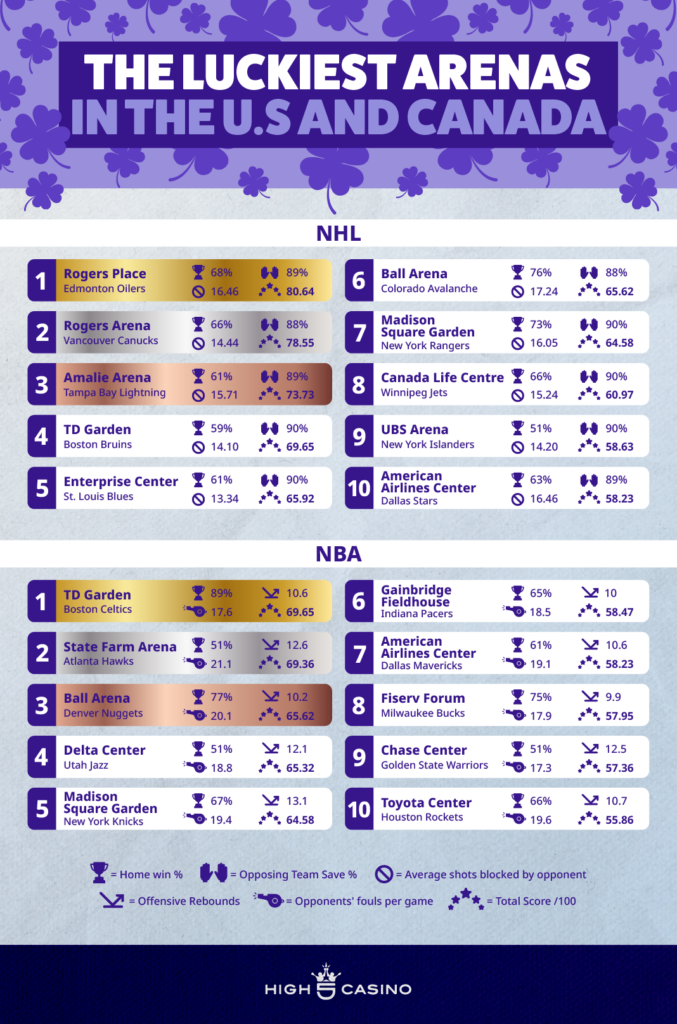
The luckiest NBA and NHL arenas
Last but not least, we have the luckiest stadiums for the NBA and NHL, and as we’ve already noted, the NHL dominates here!
The first, second, and third place are all claimed by the NHL, with Roger’s Place (Edmonton Oilers) and Roger’s Arena (Vancouver Canucks) claiming first and second with luck scores of 80.64 and 78.55, while Amalie Arena (Tampa Bay Lightning) takes third with a luck score of 73.73.
Indeed, it’s not until we reach fourth and fifth that we see an NBA team make it into the top five for luckiest stadiums, with TD Garden placing fourth with a score of 69.65.
Here, the Boston Celtics and Bruins hold a combined home win rate of 59%.
Meanwhile, in fifth, we have State Farm Arena and the Atlanta Hawks, who hold a slightly lower average win percentage of 51% for a luck score of 69.36.
And there you have it; those are the luckiest stadiums in the US and Canada!
Did your team’s stadium make the cut? Perhaps you feel your team’s home field is far luckier than we ranked it?
Either way, if you want to see if luck is on your team’s side, you can head over to High 5 today to see how they or the leading teams are looking in our sweepstake selection for the coming “Big Game” before taking our slots for a spin!
Methodology
To create this index, 140 stadiums and arenas from the 5 biggest North American sports competitions were taken into account.
Each stadium and arena was ranked for how lucky the home teams playing in them appeared to be.
Once the data for the factors was collected, they were normalized to provide each factor with a score between 0 and 1. If data was not available, a score of 0 was given.
The normalized values were then summed and multiplied to give each stadium and arena a total score out of 100. Based on their total luck scores, the stadiums and arenas were ranked from highest to lowest.
The factors used were as follows:
NFL:
- Home win % – the percentage of home wins.
- Average home points – the average number of points scored by the home team in their stadium.
- Home fumbles – the number of fumbles conceded at home.
- Average temperature – the average temperature throughout the 23/24 season, in Fahrenheit.
- Weather index – a weather index taking into account rain and snowfall.
- Wind speed – the wind speed in each stadium, impacting the speed of the ball.
MLB:
- Home win % – the percentage of home wins.
- Home batting average – the batting average when playing at home.
- HR per game – the average number of home runs scored at home throughout the season.
- Team runs per game – the average number of team runs scored at home throughout the season.
- Opponents’ fielding errors – the average number of fielding errors by opponents when playing at home.
- Walks per game – the average number of walks per game conceded by opponents when playing at home.
- Home win streaks – the highest number of games going undefeated in the 23/24 season.
- Comeback wins – the number of comebacks wins throughout the season when playing at home.
- Rainouts – the number of rainouts at the home ground throughout the 23/24 season.
NBA:
- Home win % – the percentage of home wins.
- Home 3-pointers – the percentage of 3-pointers scored at home.
- Home free throws – the percentage of free throws made at home.
- Offensive rebounds – the number of offensive rebounds made at home.
- Opponents’ fouls – the number of opponent fouls when playing at home.
NHL:
- Home win % – the percentage of home wins.
- Average home points – the average number of points scored by the home team in their arena.
- Face-off wins – the percentage of face-off wins at home.
- Opposition saves – the average number of opposition saves when playing at home.
- Blocked shots – the average number of blocked shots by an opponent when playing at home.
MLS:
- Home win % – the percentage of home wins.
- Home goals – the number of goals scored at home.
- Home points – the average number of points scored at home throughout the season.
- Clean sheets – the number of home games without conceding a goal.
- Home advantage – the home advantage percentage as calculated by https://footystats.org/.
The data is correct as of 17/01/2025 and was collected based on the 2023-2024 season.
The ranking dataset shown is a compilation of multiple data sources and may not represent real life. All data is accurate with regard to the sources provided.
Sources
- NFL – https://www.nflweather.com/
- NFL – https://www.footballdb.com/statistics/turnovers.html
- MLB – https://www.mlb.com/stats/team/batting-average
- MLB – https://www.teamrankings.com/
- MLB – https://champsorchumps.us/records/biggest-mlb-comebacks-in-2024
- MLS -https://footystats.org/usa/mls/home-advantage-table
- NBA – https://www.teamrankings.com/nba/
- NHL – https://www.quanthockey.com/nhl/standings/standings.php